
// SAMPLE REPORT
A REAL REPORT,NOTHING HIDDEN
This is an unedited Team IFC report from a Melbourne Grand Prix race, finishing P2. Every chart, every tab, exactly what you get back after you upload a session. No signup needed to look.
// INSIDE THE REPORT
EIGHT CHARTS FROM A REAL SESSION
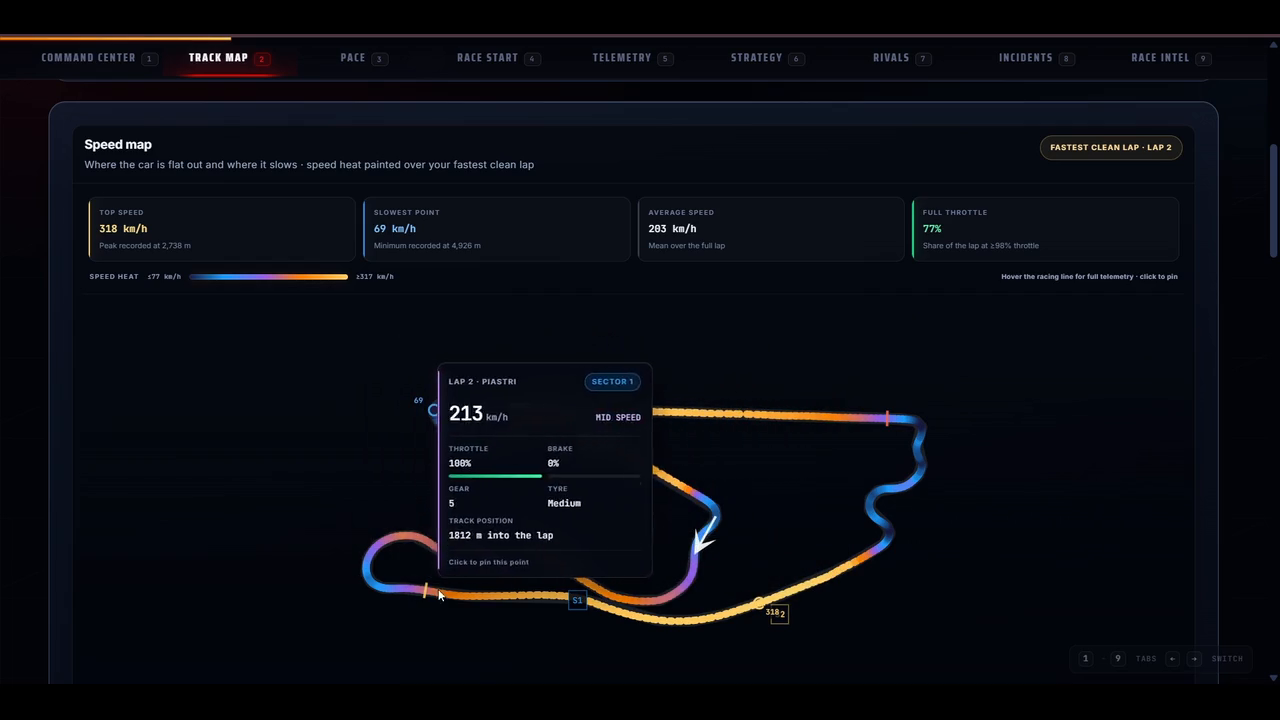
Every chart below came out of an uploaded F1 25 telemetry file. No mockups, no illustrations. Tap any chart to open it full size.
01 · LAP TIME ANALYSISPiastri lost seven tenths across sectors 1 and 2, then took half a tenth back in sector 3. Your lap against a benchmark, split by sector, with every input traced. 02 · PACE RIDGELINEWhere your lap times actually cluster against every other driver. A wide ridge is inconsistency you can feel but cannot see. 03 · EQUAL-DISTANCE SEGMENT RANKINGEvery equal-length piece of track, coloured by where you ranked in the field. The red stretches are where the lap time went. 04 · TYRE PERFORMANCEPer-wheel temperature, wear and degradation across the stint, so you know whether the pace drop was you or the tyre. 05 · ERS BATTERY AND DEPLOYMENTBattery state of charge across the session next to your rivals. Shows whether you were deploying where it actually paid. 06 · TRACTION AND BALANCE LOSSEvery lock-up, wheelspin, understeer and oversteer event placed on the track and costed in time lost. 07 · POSITION BY LAPEnd-of-lap running order for the whole field with your line highlighted, so every position change has a lap number on it. 08 · STINT-AGE PACE PROFILEFuel-corrected pace against tyre age versus the pack median. Shows whether you fell away or the field did.
OPEN THIS ON A DESKTOP
The full report is built for a wide screen. It will not display properly on a phone. Open teamifc.com/sample on a laptop or desktop to explore the real thing.
THIS IS YOUR RACE, NOT MINE
Upload one F1 25 session and get this back for your own driving. 8 free reports, no card required.
START FREE TRIAL